kScion Framegrabber Interface
Linux interface to the Scion LG3 framegrabber card
This site is under construction
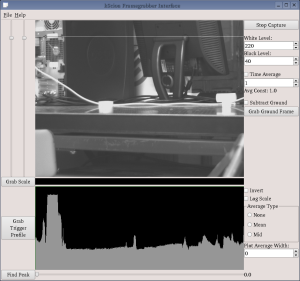
Screenshot
Bug Reports
Contact
 This software is a graphical interface for Linux to the Scion LG3 PCI framegrabber card. It uses the scionlg3 Linux driver available at Sourceforge and the KDE and Qt libraries.
Brief documentation
- You should have a device called /dev/lg3-0 which is enabled by the scionlg3 drivers.
- Start up the program and press Start Capture. If all is well, you will see the image from your camera in the main window.
- Moving the two sliders to the left of the main image window sets the vertical region which is averaged into the intensity plot below.
- There are several controls on the right side:
- The White Level and Black Level controls change their settings on the LG3 card (read the LG3 documentation for information about this)
- Clicking the Time Average check box and increasing its value will cause successive frames to be averaged together, which is great for removing noise.
- Clicking Grab Ground Frame will copy the current visible frame to a buffer, which will be subtracted from the current frame if Subtract Ground is checked.
- The Invert, Log, and Average controls will change the shape of the intensity plot.
- The Grab Scale button has one of the most powerful features; it automatically computes the scale of the image you are looking at. It does require a few steps to set it up properly, however:
- Place a ruler horizontally in front of your camera so that the tick marks are clearly visible.
- Set the upper and lower plot boundaries to cover, for example, only the millimeter marks. Now the profile of the tick marks should be clearly visible in the plot window.
- Here's the weird part; you need to tell kScion where each tick mark begins by drawing a line through the middle of the plot so that it intersects every oscillation in the middle.
- Set Plot Average Type to Mid, set the Plot Average Width to approximately the number of pixels between two peaks on the plot, and click Grab Trigger Profile.
- Now set Plot Average Type back to None and you should see a green line that runs roughly through the center of your plot.
- Click Grab Scale and the program will compute the average distance between tick marks to determine the scale.
- When you Save Plot from the File menu, you get a text file with two columns; intensity vs x position. The x position is a value from 0 to 1 if you have not used Grab Scale, or in the units of your scale if you have.